
What the online differences between the green, yellow and red zones tell us about locked-down India.
MiQ’s ‘Mood of the nation’ report is based on insights around the changing online behavior of Indian citizens and aims to provide brands with the most pertinent advice on how they can adapt their media plans to the new normal.
Though the general uptick in digital consumption remains prominent across the country, there are considerable regional differences in online content consumption. That’s why this report looks at how the different regions are faring, especially the differences across the red, yellow and green zones as described by the Indian government, and what this means for advertisers.
The changing digital opportunity
After the implementation of the lockdown, we saw a 132% increase in biddable programmatic inventory as people stayed home and spent more time online.
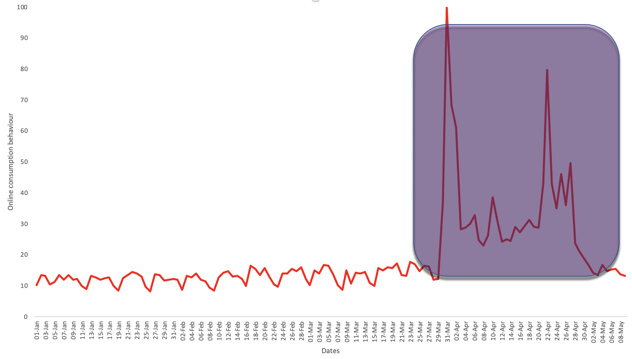
To provide a global perspective, the post-lockdown increase in digital activity in the US stands at 28% and at 46% in the UK. Among developing economies, China registered an 87% increase in the online opportunity whereas in Singapore the interest only rose by 20%.
Increased traffic on both mobile devices and desktops have contributed to this overall increase in the digital opportunity, but with the government relaxing some restrictions during phase 3 of the lockdown, we are seeing a minor decrease in the mobile consumption stats though activity on the desktops continue to remain strong.
Average biddable opportunities per day by device types
|
Device type |
Phase 3 |
Phase 2 |
Change |
|
Desktops & Laptops |
3.25 Bn |
3.01 Bn |
8.3% |
|
Media Players |
0.25 Mn |
0.24 Mn |
4.6% |
|
Mobile Phones |
9.94 Bn |
10.05 Bn |
-1.1% |
|
Tablets |
118.88 Mn |
119.77 Mn |
-0.7% |
Content consumption across domains has also seen significant change. In addition to business, industry, and news that have seen a spike of interest during the lockdown, activity on food and drinks, CPG, and arts and entertainment domains have been constantly trending upwards.
Changes in activity across different content categories online
|
Content category |
Change pre -lockdown - Phase 1 |
Change pre -lockdown - Phase 2 |
Change pre -lockdown - Phase 3 |
|
Arts & Entertainment |
221% |
364% |
25% |
|
Books & Literature |
125% |
132% |
59% |
|
Business & Industry |
475% |
318% |
31% |
|
Education |
10% |
-6% |
-17% |
|
Finance |
140% |
71% |
3% |
|
Food & Drink |
203% |
297% |
176% |
|
Games |
-9% |
12% |
-7% |
|
Health |
46% |
130% |
32% |
|
Home & Garden |
65% |
130% |
78% |
|
Lifestyles |
92% |
157% |
53% |
|
News |
251% |
189% |
35% |
|
Recreation |
44% |
217% |
-4% |
|
Shopping |
-34% |
-17% |
-31% |
|
Sports |
419% |
133% |
-27% |
|
Travel |
-23% |
162% |
-44% |
Regional Disparities in the content consumption online
The COVID-19 Zones
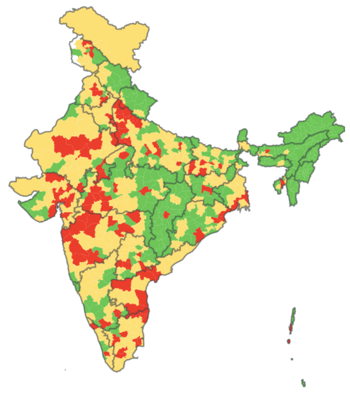
Green, Yellow and Red COVID-19 zones defined by the Government of India.
The green and yellow zones comprise a higher proportion of rural India (tier-2 and tier 3 cities) while the red zone is dominated by urban India (tier 1 cities and metros). To a great extent, rural India still consists of an ‘early to bed, early to rise’ demographic.
Online activity by time of day
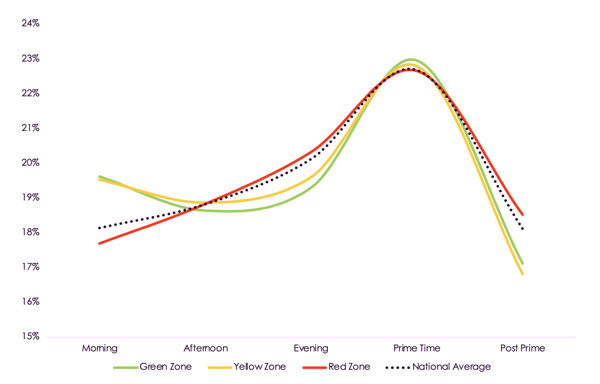
Browsing in green and yellow zones over index on national average during morning and prime time hours. The red zones show online activity increase gradually during office hours (afternoon and evening) and peak at prime time. Red zones also show a higher than average time spent online during post prime hours.
Prime time is the de facto peak time of media consumption in India, digital being no exception. It would be safe to say that prime time is a multi screen time in India when people are watching TV and active on at least one more device (mobile phones, tablets, laptops).
By aligning display and video campaigns with online behavior trends, brands are able to provide brand moments to reach consumers across multiple screens. During multi screen hours, online and mobile activation strengthens brand awareness through synergy with broadcast media campaigns. During exclusive digital hours, a focused contextual targeting strategy based on real-time data analysis and machine learning can build stronger brand association that helps migrate consumers deeper into the marketing funnel.
Understanding consumer profiles and preferences is key to any brand’s marketing and communications strategy. We often call them users, audiences, visitors, or viewers. But at the core of it, they are just people; and analysing people’s online behavior reveals a lot about what they do not articulate in words, empowering brands with insights to connect with them more personally.
In terms of content preferences, News continues to be the top domain category browsed across the three zones. Beyond this, differences in top content preferences between the three zones reveal significantly different consumer needs across India.
While green zones show a high browsing index across Arts & Entertainment, Health, and Books & Literature domain categories, yellow zones’ online viewership is skewed towards Lifestyle, Arts & Entertainment and Shopping categories.
The top keywords associated with the Arts & Entertainment domain category are “culture”, “movies”, “video”, “quiz”, “songs”, “games” and “Bollywood”. Google search trends show massive increase (>50%) in search intent for these keywords post the lockdown.
Increase in search interest for entertainment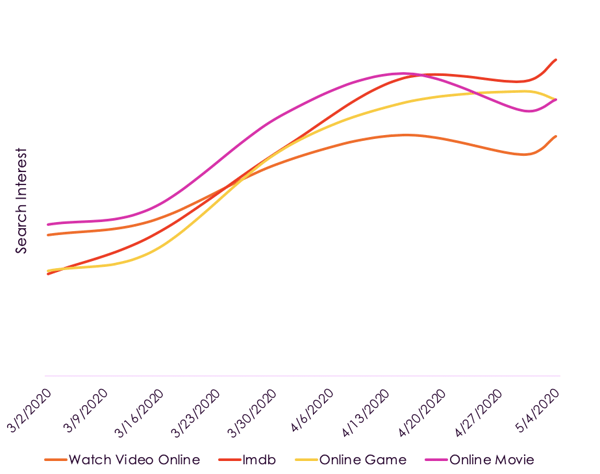
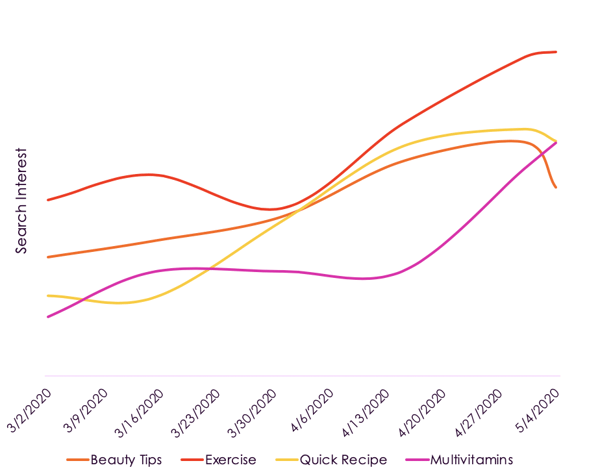
Within Health, Lifestyle and Shopping categories, the top keywords are “beauty”, “workout”, “exercise”, “online shopping”, “recipes” and “cook at home”. These keywords had at least a 30% increase in search intent post the lockdown as seen from the Google search trends below.
Increase in search interest for health & lifestyle
The audience verticals and interest segments that have the highest activity in green zones are: Entertainment - TV Viewers (8X*), Intent - Auto Buyers (5.8X), Interest - Home & Garden, Home Improvement, DIY/Handicraft (3.7X), Entertainment interest - Books (4.6X), Retail Intent - Shopping - Bargains (2.4X), Interest - Consumer Electronics (2.3X).
Yellow zone netizens index high towards the following audience segments and interest groups: Entertainment - TV Viewers (10X), Music Lovers (5X), Auto Aficionados (7X), Purchase intent - video game consoles (3X), Lifestyle segments - hobbies and interests (2X), Home improvement (DIY and handicraft), Shopping bargains and discounts (2.5X), Purchase intent - computers and laptops (2X).
*Represents how likely is a person to belong to this category compared to average online audience
Rural India’s browsing behavior exhibits three focus areas:
- Educating themselves about the virus and learning effective ways to stay safe and healthy through Health and Lifestyle content consumption
- Riding out the storm on the back of indoor Entertainment - movies, books, arts, and literature
- Online ‘window shopping’ across multiple categories like consumer electronics, auto, home improvement and handicraft, seeking discounts and bargains
While rural India is spending much more time learning and exploring online, it might be a while before spending cycles normalize. In the short term, brands will need to contextualize communications, campaigns and brand expectations to this reality.
The domain category preferences within red zones bring to light a stark contrast in needs and wants of urban vs rural India. The top categories that over index in red zones are Travel, Finance, and Food & Drink.
Urban India still very much seeks growth, asset ownership, investment, and outdoor entertainment with focus being on:
- Actively making vacation and travel plans, seeking certainty around when travel bans will be lifted
- High value purchase (homes/cars), investment opportunities and advice to cope with potential inflation, loss in pay due to furlough, pay cuts or bonus deferrals
- Food and drink with a surge in online food delivery and alcohol
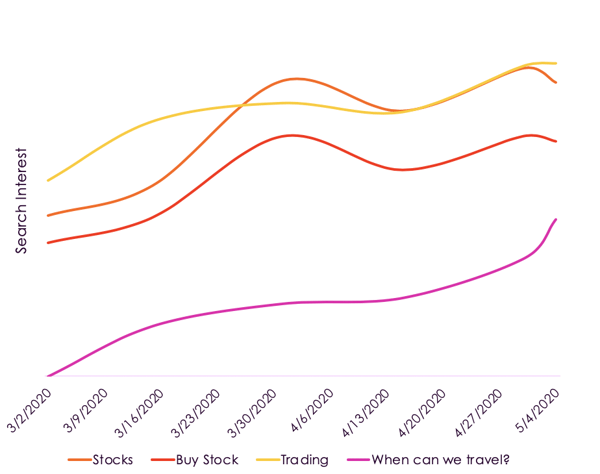
The top keywords within the dominant categories in red zones are “stocks”, “trading”, “currency”, “economy”, “when can we travel”.
Increase in search interest for finance and travel keywords
Google trends also reveals that while “buy car”, “buy house” or “buy bike” have reduced search interest, the search across “home loan”, “car loan” has persisted and started to increase. This persistence and trend reversal indicates high intent within a large section of India to still plan for high investment spending and eventually execute those plans once the lockdown is lifted.
Active audience segments for netizens in the red zones skew heavily towards travel and finance intent. The top segments and intent categories are: Travel intent - frequent (3X), travel intent - luxury (2X), and weekend travelers (2.5X), Flight booker persona (2.2x), Holiday booker persona (4X), Interest - Cruises (1.7X), Luxury shopping intent (1.6 X),Wants to buy rented holiday homes (1.7X), International travel category (1.5X), Entertainment intent - books (5X), Entertainment interest - Video on demand (1.8X), Personal finance - loan and credit (2.6X), Foodies persona (1.2X).
It is fair to say that while urban India may have temporarily reduced discretionary spending due to lockdown restrictions, the intent to purchase the best products, investment options, vacations, homes, and cars still exists and has even increased in certain categories. The most recent evidence of this is the almost 6X surge in online search for ‘alcohol near me’ and kilometres long queue outside recently opened alcohol shops.
Running successful digital campaigns during the lockdown:
Activate the right channel at the right time
Consumers have higher affinity towards brands that provide multi-moment and multi screen engagement. Activating channels based on online behavior across day parts means brands can achieve high brand awareness during multi-screen hours and drive exploration, interest and purchase during exclusive digital hours.
Personalize at scale in real-timePersonalization is key to both short-term campaign performance and long-term customer loyalty. To successfully execute personalized campaigns at scale, brands need to understand consumer behavior and preferences across location, devices, channels and content in real-time. This means integrating marketing strategy with data analytics, machine learning and technology.
Engage with real-life moments
People are more likely to invest when the market outlook is bullish or order drinks when a sports game gets interesting. Brands can now drive call to action by syncing campaign delivery with these real-life moments.
If you want insights like these delivered straight to your inbox, subscribe to our insights mailing list.
Sources:
- APN console stats, 1 Jan 2020- 9 May 2020
- AppNexus console- platform inventory stats, 9 April 2020 - 9 May 2020
- AppNexus console stats, 1 Jan 2020 - 9 May 2020
- https://www.covid19india.org/
- Online browsing behavior data, April 2020
- Google Trends Data, India, Weekly Average, March 2020 to May 2020


