
As January nears a close, fans around the world are gearing up for one of the largest sporting events in the world, the NFL Super Bowl. More than 100m people will tune in to watch the game live on screens across the United States, along with Canadian fans (who made up about 4m Super Bowl viewers last year) and those overseas staying up extra late to catch the action.
And nearly as important as the game are the ads. Super Bowl ads have become an event in themselves, with advertisers vying for a chance to reach millions of engaged fans with prestige format messaging.
At MiQ we’re big fans of the game and even bigger fans of the data - we love to understand who watches the game, how they do so, and how those habits have changed. So we’ve been digging into the data we’ve collected on viewers both online and offline to understand how advertisers can best take advantage of the Super Bowl opportunity.
Understanding last year’s audience
Let’s start by looking back at last year’s Super Bowl.
Super Bowl LIII took place on February 3 in Atlanta’s Mercedes-Benz stadium, featuring the Los Angeles Rams and the New England Patriots. By Nielsen ratings, the event ended up being one of the least-watched Super Bowls of the modern era, and the least-watched in 11 years, owing to factors such as the Patriots having been to four of the past five Super Bowls, the game’s low score (ending 13-3), and the continued shift from linear TV viewing to digital.
The game
To better understand these trends and to get a clearer picture of the game’s viewers, we looked at TV viewing data in the United States during the game, paying close attention to the halftime show and the commercial breaks as well. At the time, our dataset consisted of every opted-in Vizio smart TV in the US active during the game, a sample of 2.2m devices. Of those, 1.77m (80%) tuned into the game at least once, with the average household spending two hours watching the game.
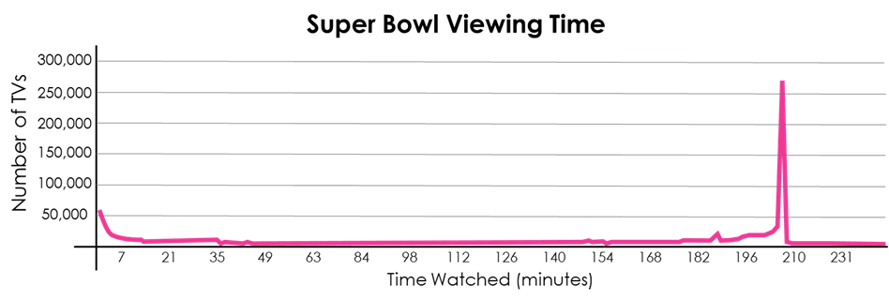
Viewership spiked sharply toward the end of the game, three and a half hours into the broadcast, when time began to run down in the fourth quarter and the game, tied at 3-3, was still very much undecided. When the Patriots closed things out, viewership dropped sharply as people changed the channel or stopped watching TV altogether. The largest percentage of TVs watched about 205 minutes of the broadcast, meaning they caught all of the game and halftime.
The biggest drop-off of viewers happened, of course, when the game ended. But where were they likely to end up? For the hosting network, the bad news is ‘not necessarily your network’. Seven per cent of viewers changed the channel to NBC to watch America’s Got Talent following the Super Bowl, the largest percentage of the audience, while The World’s Best on CBS didn’t seem to capture a significant portion of the audience.
Top Shows Watched After the Super Bowl
|
America's Got Talent |
6.91% |
|
America's Funniest Home Videos |
3.96% |
|
Dr. Pimple Popper: The Poppy Bowl |
3.82% |
|
NCIS: Los Angeles |
3.11% |
|
Shark Tank |
1.54% |
|
Ancient Aliens |
1.48% |
|
Barnwood Builders |
1.46% |
|
The Super Bowl Today |
1.44% |
|
Law & Order |
1.41% |
|
Victoria on Masterpiece |
1.36% |
The halftime show
Over the last thirty years, Super Bowl ads and the halftime show have become events as important as the game itself, with many casual viewers tuning in just to see what brands have up their sleeves. A good Super Bowl ad can stay with audiences for a long time, and spark months’ worth of buzz. Likewise, the halftime show has become a big deal as well. Half of all viewers who tuned in to the Super Bowl watched the halftime show from start to finish, and 85% watched at least part of it.
Halftime show viewers
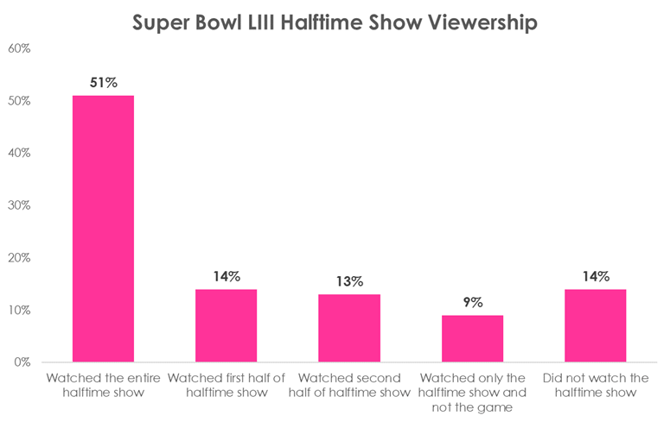
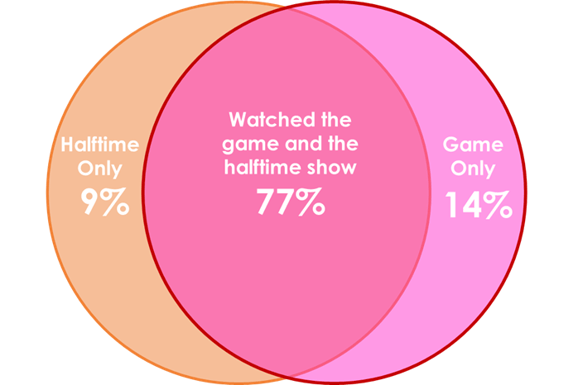
It’s worth noting that 9% of viewers had no interest in the game and only watched the halftime show, while 14% only watched the game, changing the channel or turning off the TV at halftime.
The commercials
The Super Bowl is more than just a football game. It’s an event, a celebration that, once a year, brings football lovers and everyone else together. Over the years, the hype surrounding the commercials, the performances and the parties have taken a major part of the limelight. Discarding promos and ads for the network’s shows, below were the top 10 most viewed ads during the Super Bowl. The number is the distinct TVs that were on during the airing of the ad and the percentage number is the share of overall TVs that watched at least a part of the Super Bowl.
We can use the same process we used to analyze second-by-second data during the game to work out which ads were seen by which households. For Super Bowl LIII, the most-seen ad was T-Mobile’s “We’re Here for You” spot, which was seen by 64% of TVs. This was followed by Amazon’s “Not Everything Makes the Cut” spot and Toyota’s “Toni” ad.
|
Commercial |
No. of TVs |
% of Total TVs |
|
T Mobile: We're Here For You |
1,142,313 |
64.2% |
|
Amazon: Not Everything Makes the Cut |
1,111,113 |
62.5% |
|
Toyota: Toni [T1] |
1,075,549 |
60.5% |
|
Budweiser: Wind Never Felt Better |
1,062,478 |
59.7% |
|
Devour Foods: Food Porn |
1,062,162 |
59.7% |
|
Planet Fitness: Empieza el año con $1 dólar de bajo |
1,062,111 |
59.7% |
|
Mercedes Benz: Say the Word [T1] |
1,061,870 |
59.7% |
|
Avocados from Mexico: Top Dog |
1,058,482 |
59.5% |
|
Microsoft: We All Win |
1,034,698 |
58.2% |
|
Youtube TV: Watch Like a Fan |
1,032,053 |
58.0% |
The same process that lets us know which viewers saw which ad also gives advertisers the opportunity to target their media based on that. At MiQ, we can help you connect this TV viewing to your digital campaigns, so you can retarget Super Bowl ad viewers with either brand messaging that expands or reinforces your message, or with lower-funnel messaging designed to drive action. Or, for those who missed your Super Bowl ad altogether, a video ad featuring the same spot.
Identifying shared viewing experiences
Finally we wanted to look at whether we could identify likely Super Bowl parties and environments where many people were watching on the same TV. One way to do this is to look for households where a large number of mobile devices are connected to the same IP address as a trackable smart TV, indicating that people have come over and are on the wifi network. By comparing this to other recent Sundays, we can identify where irregular numbers of devices are in play, indicating a likely party.
On average, 1.3 laptops and 2.2 mobile devices were connected to the same network per IP address for Super Bowl viewing households. These devices tended to be active, in the sense that they were conducting online activity and could be targeted with ads. However, we weren’t able to identify a significant number of households sporting a large number of devices. This suggests that, on average, either partygoers do not connect to their host’s wifi network, or they spend their time socializing with other people instead of spending time on their phones (insane, we know).
|
Device Type |
Average Devices per IP during game time |
|
Desktops/Laptop |
1.3 |
|
Mobile Phones |
2.2 |
|
Tablets |
1.1 |
For advertisers, this suggests that the play isn’t trying to reach these devices during the Super Bowl, but instead finding ways to effectively follow up with viewers after the game. At MiQ, we’re dedicated to helping advertisers build targeting strategies that take into account what people have already seen and how that will likely affect them, and help them reach those consumers in the right environments at the right times.


